A slow game does not always mean your gaming laptop needs an upgrade. How to check CPU and GPU bottlenecks on a gaming laptop starts with monitoring processor load, graphics utilization, frame times, temperatures, and power limits during real gameplay. This guide explains how to identify the limiting component and choose the right next step.
What CPU and GPU Bottlenecks Really Come Down To
A bottleneck occurs when one part of the system limits how quickly the game can produce frames. To identify it accurately, compare CPU and GPU behavior while playing the same scene, then check whether temperatures, power settings, frame caps, or memory pressure explain the results. Neither component needs to run at 100% at all times.
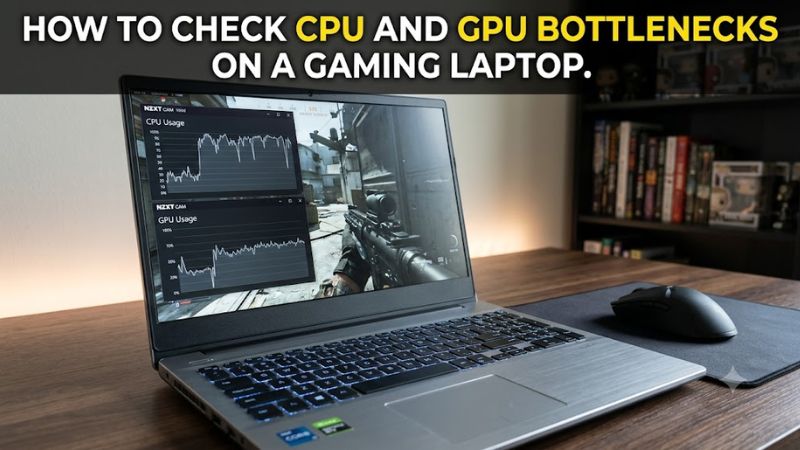
Understand CPU-bound and GPU-bound performance
A CPU bottleneck occurs when the processor cannot prepare game data quickly enough for the graphics processor to render additional frames. This often happens in crowded open-world areas, large strategy battles, simulation games, or scenes with many characters and complex physics. Overall CPU usage can look moderate even when one important processing thread is saturated.
A GPU bottleneck occurs when the graphics processor needs more time to render each frame than the CPU needs to prepare it. High resolutions, demanding lighting, ray tracing, and detailed visual effects can increase GPU workload. Sustained GPU utilization near 95–100% often indicates a GPU limit when frame rates are not capped, although the percentage alone cannot establish the cause.
Recognize why gaming laptops need extra checks
Laptop processors and graphics chips operate within platform-specific thermal and power limits. Performance can change between battery and AC power, manufacturer performance profiles, and different cooling conditions. A laptop GPU also shares a limited cooling system and power budget with the CPU, so one component’s behavior may change when both are under heavy load.
Before diagnosing a bottleneck, connect the original or manufacturer-approved AC adapter, select the intended performance profile, and allow the laptop to reach its normal operating temperature. Check that the game is using the intended discrete GPU where applicable. These conditions help distinguish a genuine performance limit from an unintended power-saving setting.
Know which readings matter
GPU utilization, CPU per-core usage, frame rate, and frame time provide a useful starting point. Temperatures, clock speeds, GPU power draw, and memory use help explain why performance changes. Windows Task Manager offers basic utilization data, while monitoring utilities such as MSI Afterburner with RivaTuner Statistics Server or HWiNFO can provide more detailed in-game readings.
No single reading tells the whole story. A GPU at 70% utilization could be waiting for the CPU, obeying a frame cap, sharing resources with another process, or operating under a power or thermal restriction. Compare several measurements over the same gameplay segment before deciding which explanation fits.
What doesn’t help
Online bottleneck calculators cannot reliably diagnose every laptop because they generally cannot account for the exact game, resolution, laptop power limits, cooling behavior, graphics mode, and frame-rate cap. Treat their estimates as rough context rather than a diagnosis. A CPU-to-GPU pairing that looks unbalanced on paper may perform well in the games you actually play.
Avoid changing several settings simultaneously or buying replacement hardware based on one utilization screenshot. Gaming laptops often have soldered CPUs and GPUs, making component replacement impractical. Start with monitoring and repeatable comparisons, then adjust software settings only when the evidence points to a specific limit.
How to Check CPU and GPU Bottlenecks: Step by Step
The most reliable way to check CPU and GPU bottlenecks on a gaming laptop is to monitor both components during a repeatable gameplay scene, then change one variable at a time. Start with Windows Task Manager for a quick overview; use an in-game overlay for sustained measurements, and check temperature, clock speed, and power draw when utilization does not explain the frame rate.
Step 1: Record CPU and GPU usage during gameplay
Press Ctrl + Shift + Esc to open Task Manager, then select Performance and inspect CPU, GPU, memory, and other relevant activity. Keep in mind that switching out of a game can change its workload, so Task Manager is best used for an initial check rather than as your only source of evidence.
For a more useful view, install MSI Afterburner and its optional RivaTuner Statistics Server component from trusted sources. Open Settings, select Monitoring, and enable the available CPU usage, GPU usage, frame rate, frame time, temperature, and clock-speed readings you need. Enable the on-screen display for those metrics, then play a representative section of the game.
Step 2: Interpret the utilization pattern
Use the following table as a diagnostic guide, not a set of rigid thresholds. The same laptop can be GPU-limited in a visually demanding game and CPU-limited in a simulation. A frame cap, V-Sync, background work, or laptop power management can also reduce utilization without indicating a hardware mismatch.
| Setting or Step | Where | Effect | Risk |
| Monitor GPU usage | Task Manager or an in-game overlay | Shows how busy the graphics processor is | A single reading can mislead |
| Monitor CPU usage per core | Monitoring overlay or sensor utility | Helps reveal a heavily loaded game thread | Overall CPU usage can hide individual core limits |
| Track frame time and FPS | In-game overlay | Reveals inconsistent frame delivery as well as average speed | Overlays may add minor overhead |
| Check temperatures, clocks, and power | HWiNFO or supported monitoring sensors | Helps distinguish a workload limit from thermal or power restrictions | Sensor names and availability vary by laptop |
Interpret the readings as follows:
- GPU consistently near full utilization: The game is likely GPU-bound if the frame rate is below your target and no frame cap is active.
- GPU utilization falls while one or more CPU cores remain heavily loaded: A CPU limit becomes more likely, particularly if lowering resolution barely improves frame rate.
- Both CPU and GPU utilization appear low: Check frame caps, V-Sync, power-saving profiles, background activity, memory pressure, and whether the game is using the intended GPU.
- Frame rate declines as temperatures rise or clocks fall: Investigate cooling and power limits before blaming the CPU-to-GPU balance.
Step 3: Run a controlled resolution comparison
Choose a repeatable scene, such as the same save location, benchmark sequence, or busy multiplayer area. Record the frame rate and utilization at your usual resolution and graphics settings. Then lower the resolution while leaving other settings unchanged as far as possible, and repeat the same scene under comparable conditions.
If frame rate rises substantially at the lower resolution while GPU utilization was high, the original workload was probably GPU-limited. If performance changes little and GPU utilization remains low, a CPU limit or another constraint becomes more plausible. This is supporting evidence, not a definitive test: changes in upscaling, dynamic resolution, CPU workload, or frame caps can complicate the comparison.
Step 4: Check for thermal and power restrictions
Open HWiNFO in sensor mode or use the monitoring utility supported by your laptop. Observe CPU and GPU temperatures, effective clocks, GPU power, and any available thermal or power-limit indicators while the game runs. Compare the start and later portions of the same session to see whether performance changes as the system warms up.
Do not diagnose thermal throttling from temperature alone. Laptop chips can operate at high temperatures within their designed limits, and exact thresholds differ by model. A combination of falling clocks, reduced performance, and a relevant limit indicator is more informative. If the laptop runs hot, check air vents, fan operation, the manufacturer’s performance profile, and the AC adapter before considering more invasive changes.
FAQ
1. How can I tell whether my gaming laptop is CPU- or GPU-bottlenecked?
You can distinguish the two by comparing CPU per-core load, GPU utilization, and frame rate during gameplay. Sustained high GPU utilization usually indicates a graphics limit, while a heavily loaded CPU thread and underused GPU suggest a processor limit. Check frame caps and temperatures before drawing a conclusion.
2. Can Task Manager identify a CPU or GPU bottleneck?
Task Manager can provide an initial indication by showing CPU and GPU utilization, but it is not sufficient for every diagnosis. Use an in-game monitoring overlay when you need to correlate utilization with frame rate and frame time. Per-core CPU readings and hardware sensor data provide additional context when available.
3. Does lowering resolution help identify a CPU bottleneck?
Yes, lowering resolution can help distinguish a CPU limit from a GPU limit when you repeat the same scene under comparable conditions. If frame rate improves significantly, the GPU was likely limiting performance at the original resolution. If it barely changes, investigate CPU load, frame caps, power settings, and other possible constraints.
4. Do I need to upgrade my gaming laptop if I find a bottleneck?
No, finding a bottleneck does not automatically mean you need an upgrade. Adjust graphics settings for a GPU limit, investigate CPU-heavy game settings for a processor limit, and check cooling or power restrictions when clocks fall unexpectedly. Since laptop CPUs and GPUs are often soldered, verify upgrade options before spending money.
Final Thoughts
Learning how to check CPU and GPU bottlenecks on a gaming laptop helps you identify the actual cause of low FPS before changing settings or spending money. Monitor both components in a repeatable game scene, compare performance at a lower resolution, and investigate temperature and power limits. Address the measured constraint first.